Free Access
Fig. 3
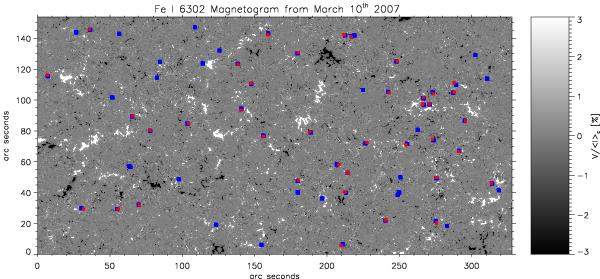
Spatial distribution of the blue and red cases over the Fe i 6302.5 Å magnetogram from the Hinode/SP normal map. Blue squares indicate the location of the blue events, while red squares designate the position of the red events.
Current usage metrics show cumulative count of Article Views (full-text article views including HTML views, PDF and ePub downloads, according to the available data) and Abstracts Views on Vision4Press platform.
Data correspond to usage on the plateform after 2015. The current usage metrics is available 48-96 hours after online publication and is updated daily on week days.
Initial download of the metrics may take a while.