Free Access
Fig. 6
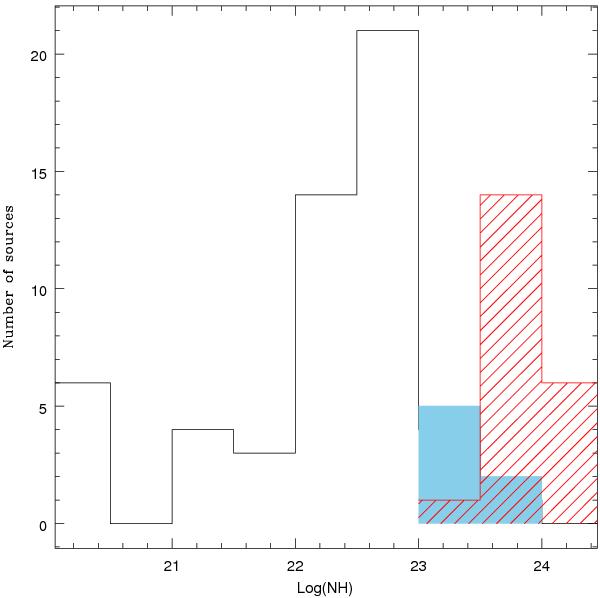
Column density distribution from the manual analysis for the 81 highly absorbed candidates: the line-shaded histogram correspond to the 21 CT plus near-CT AGNs, filled histogram to the 7 highly absorbed but not CT or near-CT AGNs, and the empty histogram to the remaining AGNs.
Current usage metrics show cumulative count of Article Views (full-text article views including HTML views, PDF and ePub downloads, according to the available data) and Abstracts Views on Vision4Press platform.
Data correspond to usage on the plateform after 2015. The current usage metrics is available 48-96 hours after online publication and is updated daily on week days.
Initial download of the metrics may take a while.