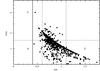
Fig. 10
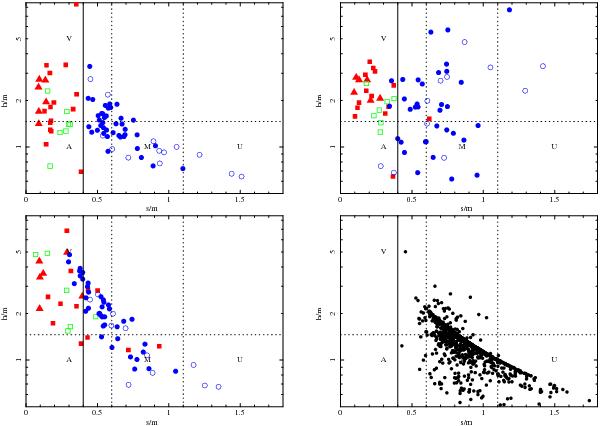
X-ray colors as in Iwasawa et al. (2012). Different symbols correspond to column densities from manual spectral fits: CT candidate (filled squares), near-CT (filled triangles), log (NH) > 23 (empty squares), 22 < log (NH) < 23 (filled circles), and log (NH) < 22 (empty circles). Top-left: X-ray colors derived from manual spectral analysis. Top-right: colors obtained by using HEASARC PIMMS (see text for details). Bottom-left: colors obtained by using automated spectral fits. Bottom-right: colors obtained by using automated spectral fits for the sources not belonging to the sample of highly absorbed candidates.
Current usage metrics show cumulative count of Article Views (full-text article views including HTML views, PDF and ePub downloads, according to the available data) and Abstracts Views on Vision4Press platform.
Data correspond to usage on the plateform after 2015. The current usage metrics is available 48-96 hours after online publication and is updated daily on week days.
Initial download of the metrics may take a while.