Fig. 6
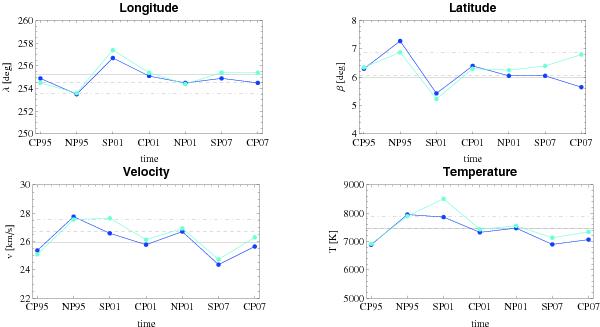
Results of gas inflow parameter fitting for the orbital arcs arranged in a time sequence, shown for both the original and the newly reprocessed data sets. The horizontal axes identify the arcs defined in Fig. 1, with the parameters defined in Tables 2 (shown as the cyan symbols) and 3 (dark-blue). The solid horizontal bars mark the result of optimization for all data from three seasons (see Table 1), the dashed line the solution with the lowest χ2 value from the reprocessed data set, and the dash-dotted line the solutions for the original data set.
Current usage metrics show cumulative count of Article Views (full-text article views including HTML views, PDF and ePub downloads, according to the available data) and Abstracts Views on Vision4Press platform.
Data correspond to usage on the plateform after 2015. The current usage metrics is available 48-96 hours after online publication and is updated daily on week days.
Initial download of the metrics may take a while.