Fig. 12
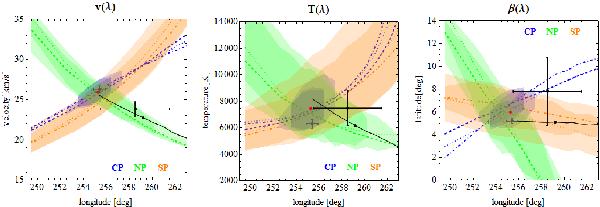
Acceptable parameter regions based on various cuts of the data. The criterion is that χ2(λ) is within 2 from the minimum for the respective cut and season. The colored regions correspond to the orbital arcs for individual seasons. The green region corresponds to the north-polar passes (NP), the orange region to the south-polar passes (SP), the blue region to the common-part scans (CP). A higher intensity of a color means an intersection of acceptable regions obtained from different seasons for a given orbital arc. The color lines of different styles mark the parameter correlation lines from Fig. 9 for different seasons. The black line is the acceptable parameter line from IBEX (Bzowski et al. 2012), with the best solution marked with the black point. The red dot marks the parameters obtained from χ2 minimization of all GAS/Ulysses data available (this work). The big black cross marks the LIC flow parameters from Redfield & Linsky (2008), the small gray cross the NIS He inflow parameters from Witte (2004).
Current usage metrics show cumulative count of Article Views (full-text article views including HTML views, PDF and ePub downloads, according to the available data) and Abstracts Views on Vision4Press platform.
Data correspond to usage on the plateform after 2015. The current usage metrics is available 48-96 hours after online publication and is updated daily on week days.
Initial download of the metrics may take a while.