Fig. 11
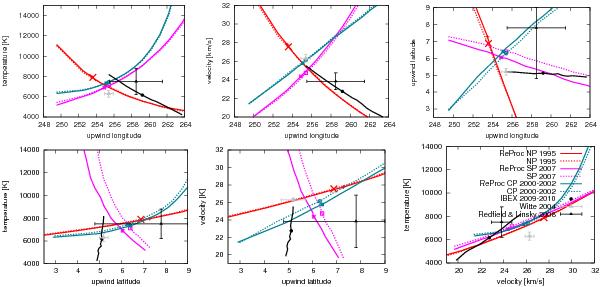
Parameter correlation lines obtained from analysis of the original and reprocessed data set, shown for the north and south polar passes, and for the common parts of the orbits, for all three Ulysses polar orbits. The data selection is presented in Fig. 10. Solid lines represent lines from the reprocessed data, broken lines from the original data. The black line represents the acceptable parameter line from IBEX (Bzowski et al. 2012), the black cross the interstellar gas parameters obtained by Redfield & Linsky (2008) from an analysis of interstellar absorption lines (with uncertainties), the gray cross marks the NIS He parameters found by Witte (2004), converted to J2000. The dots with the same color as the line colors mark the parameters for which the reduced-χ2(λ) minimum was found for a given subset of data.
Current usage metrics show cumulative count of Article Views (full-text article views including HTML views, PDF and ePub downloads, according to the available data) and Abstracts Views on Vision4Press platform.
Data correspond to usage on the plateform after 2015. The current usage metrics is available 48-96 hours after online publication and is updated daily on week days.
Initial download of the metrics may take a while.