Fig. 1
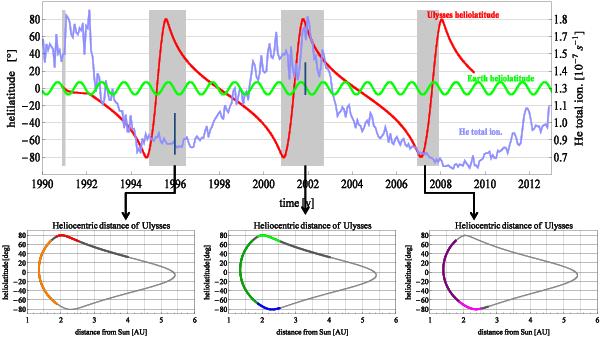
Summary of GAS/Ulysses observations. Upper panel: Ulysses heliolatitude since launch until the end of mission in 2009 (red line, left-hand vertical scale). The green line shows the Earth heliolatitude. The blue line (right-hand scale) illustrates the helium photoionization rate used in this study, adopted from Bzowski et al. (2013a). The two vertical bars mark the ionization rates (with uncertainties) obtained by Witte (2004) in his original analysis of the GAS observations. The gray regions mark the three GAS observation seasons on the polar orbit and the observation time during the in-ecliptic cruise phase shortly after launch. Three lower panels: heliolatitude-solar distance hodograph of Ulysses during the three polar orbits. The dark-gray regions mark full analyzed seasons, and the colored arcs superimposed on the dark-gray line mark the arcs discussed farther in the text. The sum of the colored arcs is the entire data set for a given orbit. The orange, dark-green, and dark-purple arcs mark the arcs common between the three polar orbits. In the further part of the paper they are called CP95, CP01, and CP07. The red and light-green arcs mark the north polar scans, performed on the first and second polar orbit (NP95 and NP01, respectively), and the blue and magenta arcs mark the two south polar passes (SP01 and SP07), executed on the second and third orbit. The boundaries of these arcs were carefully selected so that the heliolatitude ranges match between the orbits.
Current usage metrics show cumulative count of Article Views (full-text article views including HTML views, PDF and ePub downloads, according to the available data) and Abstracts Views on Vision4Press platform.
Data correspond to usage on the plateform after 2015. The current usage metrics is available 48-96 hours after online publication and is updated daily on week days.
Initial download of the metrics may take a while.