Fig. 7
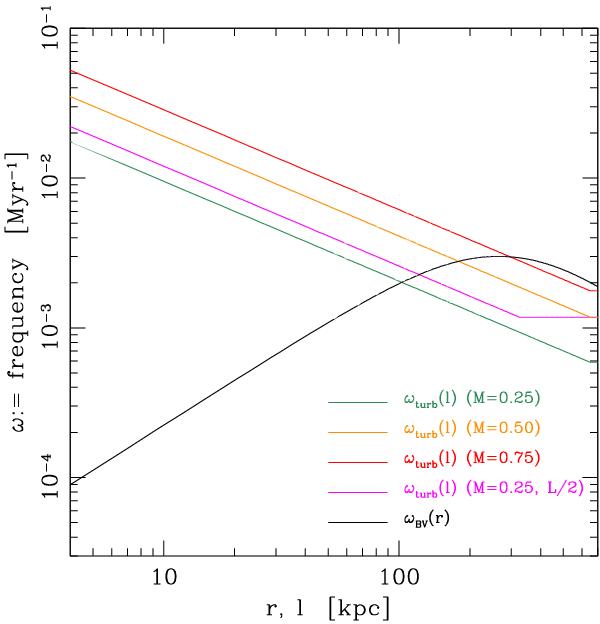
Typical frequency of the turbulent motions including the cascade (for the simulated sample M = 0.25 → 0.75), compared with the Brunt-Väisälä buoyancy frequency (black). The minimum turbulence frequency is at the injection scale, typically L ~ 600 kpc. For ωturb<ωBV (Froude < 1), g-waves tend to dominate driving entropy fluctuations, while sound waves drive stronger pressure perturbations in the opposite regime. Both types of perturbations are ∝M.
Current usage metrics show cumulative count of Article Views (full-text article views including HTML views, PDF and ePub downloads, according to the available data) and Abstracts Views on Vision4Press platform.
Data correspond to usage on the plateform after 2015. The current usage metrics is available 48-96 hours after online publication and is updated daily on week days.
Initial download of the metrics may take a while.