Fig. 6
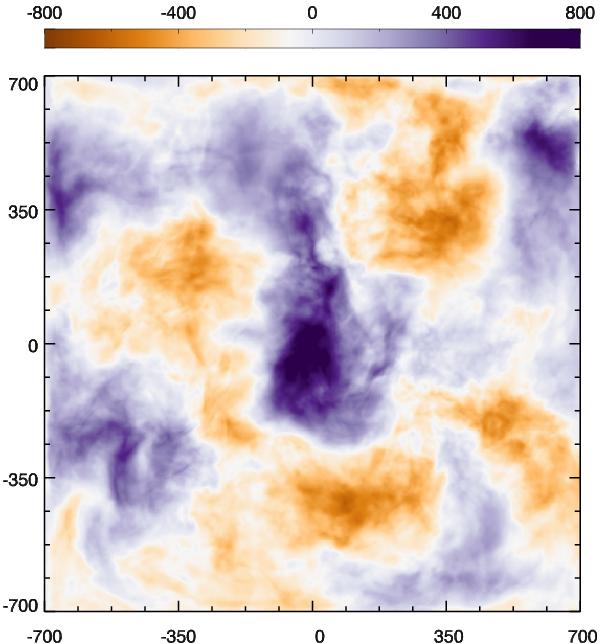
X-ray emission-weighted velocity (km s-1) along the y-axis for the hydro model with M ~ 0.5 (compare with the first row in Fig. 4; the conductive models display similar maps.). The projected velocity highlights only the large-scale motions, which dominate the kinetic energy content in our (and cosmological) runs due to the injection at L> 100 kpc.

Current usage metrics show cumulative count of Article Views (full-text article views including HTML views, PDF and ePub downloads, according to the available data) and Abstracts Views on Vision4Press platform.
Data correspond to usage on the plateform after 2015. The current usage metrics is available 48-96 hours after online publication and is updated daily on week days.
Initial download of the metrics may take a while.