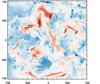
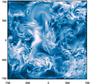
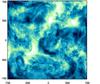
Fig. 4
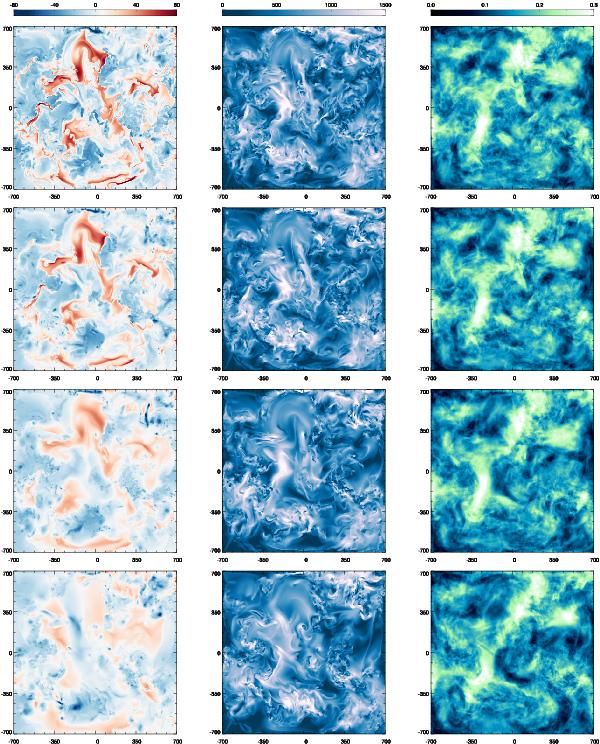
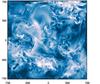
Left: mid-plane cross-sections of δρ/ρ (percent)
for the models with M ~
0.5. From top to bottom: increasing conduction
with f = 0
(hydro), 10-3,
10-2, 10-1 (the latter
very similar to the f =
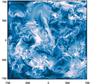
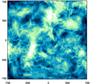
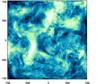
1 run). Middle: same cross-sections but for the
module of total velocity (km s-1). The hydro runs show sharp filamentary density
structures produced by the turbulent velocity field, which are later deformed by
Kelvin-Helmholtz and Rayleigh-Taylor instabilities. Strong conduction damps these
perturbations, while leaving the Kolmogorov cascade of turbulent eddies unaltered. The
v and
δρ/ρ fields
have correlated amplitude but different phases (the density field is the tracer).
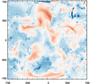
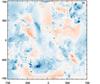
Right: observed relative line broadening (percent) due to turbulent
motions along the y-axis view,
 , where σ1D,ew is the
projected X-ray emission-weighted velocity dispersion. The forthcoming Astro-H
telescope should be able to detect projected turbulent velocities above
~200 km s-1 or ΔE/E0>
0.1 percent (FWHM = 1.66 ΔE), using the
Fe XXV line.
, where σ1D,ew is the
projected X-ray emission-weighted velocity dispersion. The forthcoming Astro-H
telescope should be able to detect projected turbulent velocities above
~200 km s-1 or ΔE/E0>
0.1 percent (FWHM = 1.66 ΔE), using the
Fe XXV line.


Current usage metrics show cumulative count of Article Views (full-text article views including HTML views, PDF and ePub downloads, according to the available data) and Abstracts Views on Vision4Press platform.
Data correspond to usage on the plateform after 2015. The current usage metrics is available 48-96 hours after online publication and is updated daily on week days.
Initial download of the metrics may take a while.