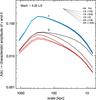
Fig. 1
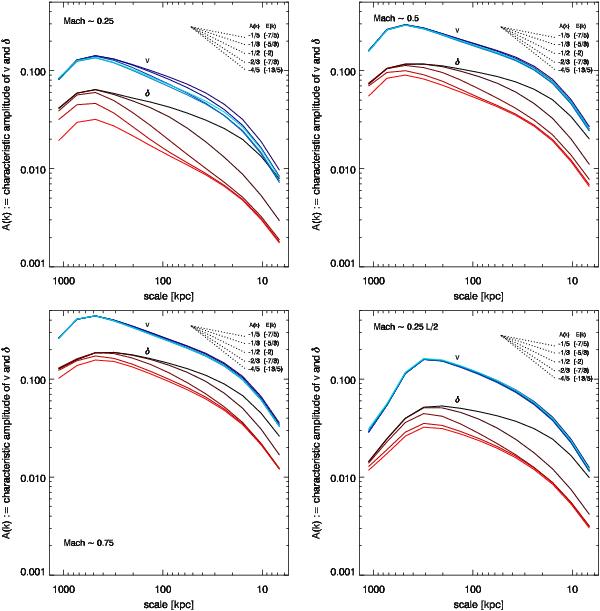
Characteristic amplitude ( )
of δρ/ρ (red)
and v/cs
(blue) after reaching a statistical steady state (~ 2 tturb)
with the same level of continuous stirring. From top left: models
with weak (M ~
0.25), mild (M ~ 0.5), and strong (M ~ 0.75) turbulence;
the last model (bottom right) has half the reference injection scale
(~600/2 kpc) using
M ~
0.25. From dark to bright line color, the level of conduction
increases by a factor of 10: f = 0 (hydro),
10-3, 10-2,
10-1, 1. The evolution is overall
self-similar by varying the strength of turbulence or the injection scale. Density
perturbations are an effective tracer of the velocity field, especially on large
scales, with normalization Av1D ≈ 1.3
Aρ (at
L ~ 600
kpc). On smaller scales, δρ/ρ displays
a cascade shallower than the Kolmogorov slope followed by velocities. Remarkably,
conduction strongly damps density perturbations but leaves the velocity cascade
unaltered, thus inverting the Av(k)
/Aρ(k)
ratio (Fig. 2).
)
of δρ/ρ (red)
and v/cs
(blue) after reaching a statistical steady state (~ 2 tturb)
with the same level of continuous stirring. From top left: models
with weak (M ~
0.25), mild (M ~ 0.5), and strong (M ~ 0.75) turbulence;
the last model (bottom right) has half the reference injection scale
(~600/2 kpc) using
M ~
0.25. From dark to bright line color, the level of conduction
increases by a factor of 10: f = 0 (hydro),
10-3, 10-2,
10-1, 1. The evolution is overall
self-similar by varying the strength of turbulence or the injection scale. Density
perturbations are an effective tracer of the velocity field, especially on large
scales, with normalization Av1D ≈ 1.3
Aρ (at
L ~ 600
kpc). On smaller scales, δρ/ρ displays
a cascade shallower than the Kolmogorov slope followed by velocities. Remarkably,
conduction strongly damps density perturbations but leaves the velocity cascade
unaltered, thus inverting the Av(k)
/Aρ(k)
ratio (Fig. 2).
Current usage metrics show cumulative count of Article Views (full-text article views including HTML views, PDF and ePub downloads, according to the available data) and Abstracts Views on Vision4Press platform.
Data correspond to usage on the plateform after 2015. The current usage metrics is available 48-96 hours after online publication and is updated daily on week days.
Initial download of the metrics may take a while.