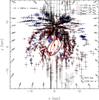
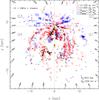
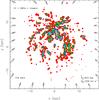
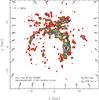
Fig. 7

Upper panels: distributions of HII regions, GMCs, and 6.7 GHz methanol masers with (left) and without (right) position error bars. The symbols for HII regions, GMCs, and masers are the same as those in Fig. 2. Lower left: color map of all tracers brightened with a Gaussian function with the amplitude of a weight factor, compared to the color map in the lower right panel which is constructed using the 815 HII regions and 963 GMCs collected in our previous work (Hou et al. 2009).
Current usage metrics show cumulative count of Article Views (full-text article views including HTML views, PDF and ePub downloads, according to the available data) and Abstracts Views on Vision4Press platform.
Data correspond to usage on the plateform after 2015. The current usage metrics is available 48-96 hours after online publication and is updated daily on week days.
Initial download of the metrics may take a while.