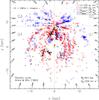
Fig. 15
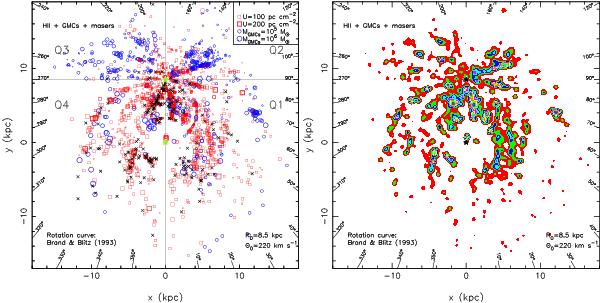
Left: distributions of HII regions, GMCs, and 6.7 GHz methanol masers projected into the Galactic plane. The symbols are the same as those in Fig. 2. The kinematic distances are estimated using the rotation curve of BB93. Right: color intensity map of spiral tracers. The IAU standard R0 = 8.5 kpc and Θ0 = 220 km s-1 and standard solar motions are adopted in deriving the kinematic distances if no photometric or trigonometric distance is available.
Current usage metrics show cumulative count of Article Views (full-text article views including HTML views, PDF and ePub downloads, according to the available data) and Abstracts Views on Vision4Press platform.
Data correspond to usage on the plateform after 2015. The current usage metrics is available 48-96 hours after online publication and is updated daily on week days.
Initial download of the metrics may take a while.