Fig. 3
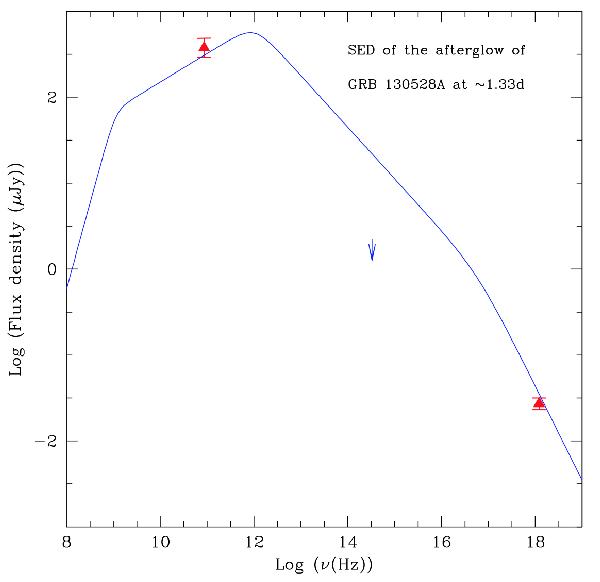
SED of GRB 130528A afterglow at 1.33 days. A model is overplotted with the observed data, assuming νa = 1.1 × 10⁹ Hz, νm = 1.1 × 10¹², νc = 6 × 10¹⁶, Fνmax = 700 μJy, p = 2.2, and a smoothing parameter s = 3 in the case of the interstellar medium model νa<νm<νc. The red arrows represent observed flux in the radio and X-ray at 1.33 days. The blue arrow shows the I-band upper limit observed by 1.5 m OSN at a similar epoch. The low upper limit can be explained by a significant extinction in the line-of-sight.
Current usage metrics show cumulative count of Article Views (full-text article views including HTML views, PDF and ePub downloads, according to the available data) and Abstracts Views on Vision4Press platform.
Data correspond to usage on the plateform after 2015. The current usage metrics is available 48-96 hours after online publication and is updated daily on week days.
Initial download of the metrics may take a while.