Fig. 7
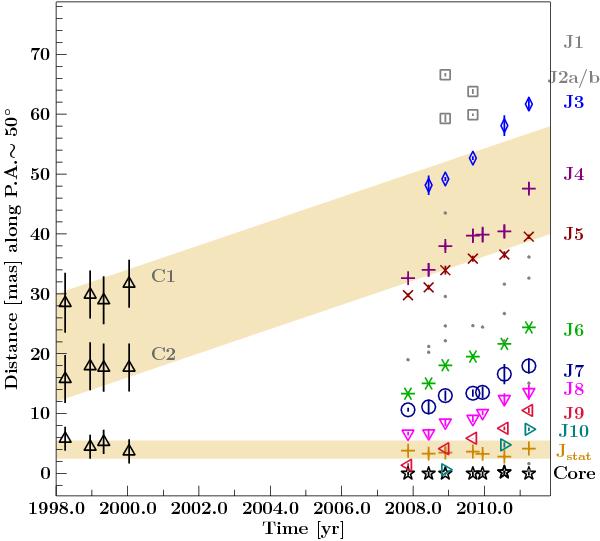
8.4 GHz kinematic results of Cen A by Tingay et al. (2001; open triangles) and the 2007–2011 TANAMI data. The shaded region marks the expected velocity evolution using μ = 2 mas yr-1, which is comparable to the mean apparent speed given by the tapered TANAMI images (see text for details).
Current usage metrics show cumulative count of Article Views (full-text article views including HTML views, PDF and ePub downloads, according to the available data) and Abstracts Views on Vision4Press platform.
Data correspond to usage on the plateform after 2015. The current usage metrics is available 48-96 hours after online publication and is updated daily on week days.
Initial download of the metrics may take a while.