Fig. 6
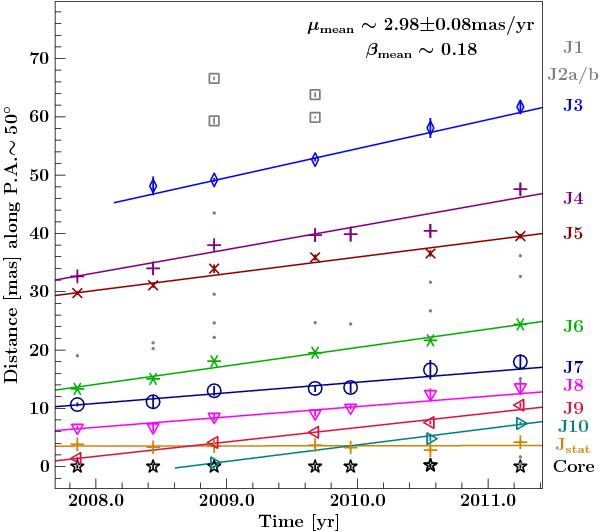
Component distance from the core component (set to zero) as a function of time (see Table A.1 for model parameters). For the identified components (colored symbols), the error bars show the systematic errors, which are defined as 0.5 × bmaj for resolved components. For unresolved components, the resolution limit is used (Kovalev et al. 2005). A linear regression fit to associated components is shown. Components not included in the fit are shown in gray. We note, in particular, the components in the region of the “tuning fork” are excluded since the region is too complex. The mean apparent speed is determined for components J3 to J10.
Current usage metrics show cumulative count of Article Views (full-text article views including HTML views, PDF and ePub downloads, according to the available data) and Abstracts Views on Vision4Press platform.
Data correspond to usage on the plateform after 2015. The current usage metrics is available 48-96 hours after online publication and is updated daily on week days.
Initial download of the metrics may take a while.