Fig. 5
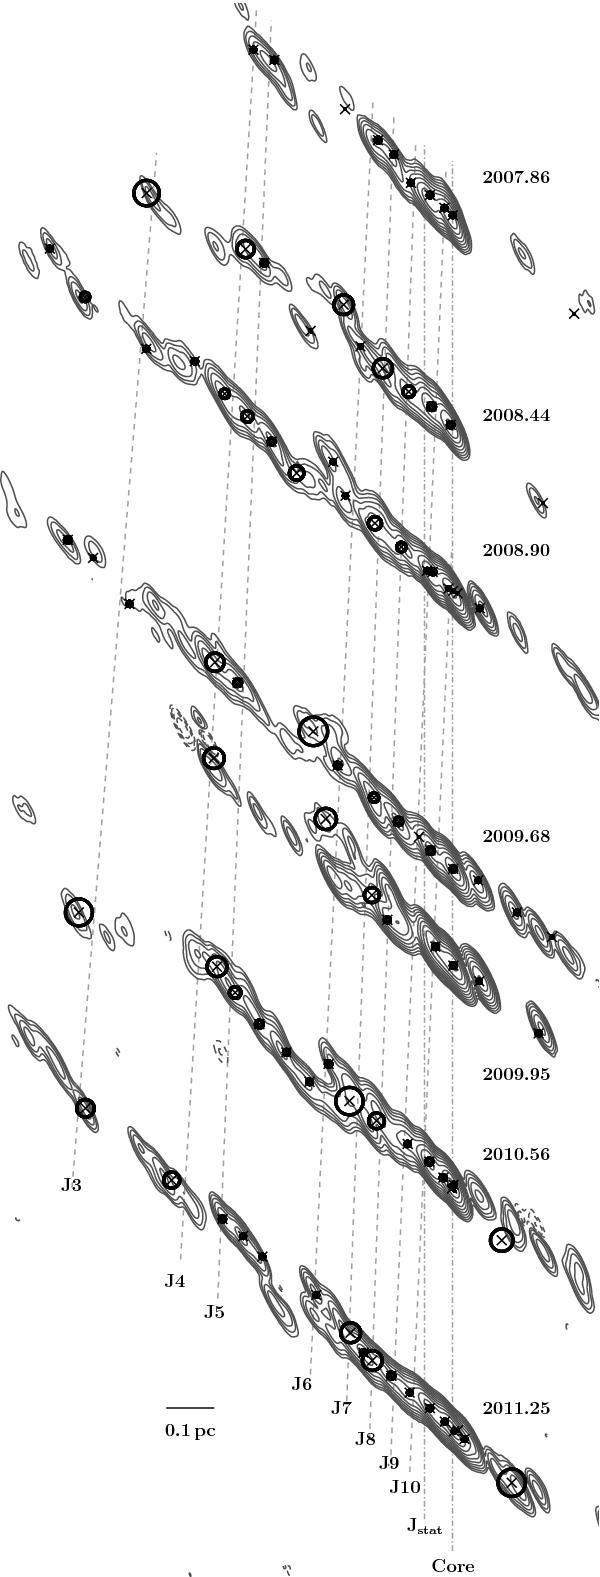
Time evolution of Cen A at 8.4 GHz. Contour clean images, restored with a common beam of (3.33 × 0.78) mas at PA = 26.3°. The contours indicate the flux density level, scaled logarithmically, and increased by a factor of 2, with the lowest level set to the 5σ-noise-level. The positions and FWHMs of the Gaussian modelfit components are overlaid as black circles (for model parameters see Table A.1).
Current usage metrics show cumulative count of Article Views (full-text article views including HTML views, PDF and ePub downloads, according to the available data) and Abstracts Views on Vision4Press platform.
Data correspond to usage on the plateform after 2015. The current usage metrics is available 48-96 hours after online publication and is updated daily on week days.
Initial download of the metrics may take a while.