Fig. 3
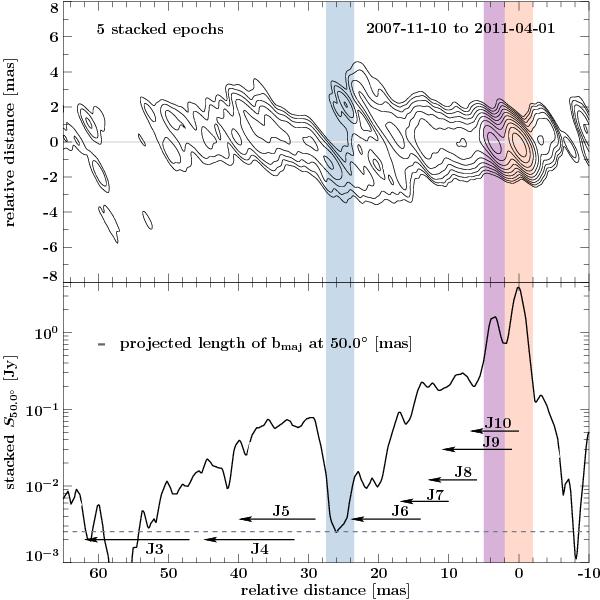
Top: stacked CLEAN image. The five highest resolution TANAMI images (epoch 2007.86, 2008.9, 2009.68, 2010.56, 2011.25) were restored with a common beam of size (2.29 × 0.58) mas at PA = 15.6° and rotated by 40°. Bottom: flux density profile along the jet axis (at PA = 50°) of stacked 8.4 GHz CLEAN images. The gray dashed line indicates the noise level of the stacked image. The orange and purple shaded areas mark the core region and the stationary component, respectively. The blue shaded area at 25.5 ± 2.0 mas away from the phase center indicates the region of the jet where the widening and decrease in surface brightness at 8 GHz occurs. The projection of the restoring beam width onto the jet axis is shown as a gray line. The black arrows indicate the traveled distances of the identified components causing a smoothing of the profile due to the jet flow with μmean ~ (2−3) mas yr-1 (see Sect. 3.3 and compare to Tingay et al. 2001).
Current usage metrics show cumulative count of Article Views (full-text article views including HTML views, PDF and ePub downloads, according to the available data) and Abstracts Views on Vision4Press platform.
Data correspond to usage on the plateform after 2015. The current usage metrics is available 48-96 hours after online publication and is updated daily on week days.
Initial download of the metrics may take a while.