Fig. 10
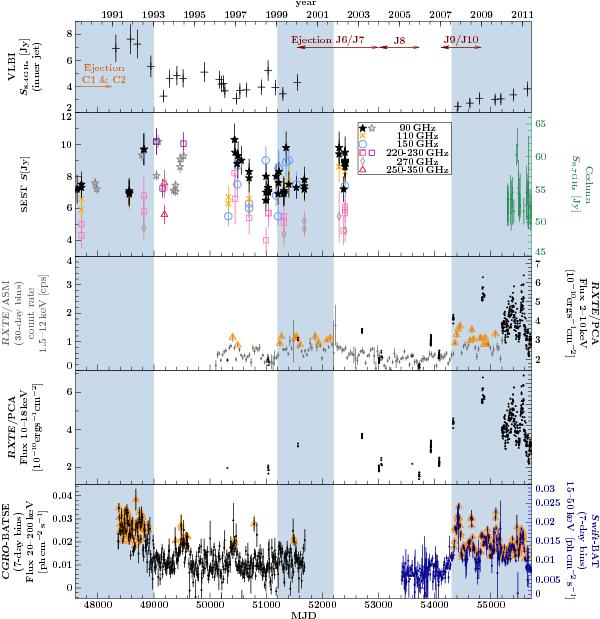
Radio and X-ray light curves of the Cen A core. From top to bottom: archival (Tingay et al. 1998, 2001) and TANAMI 8.4 GHz flux density of inner jet (−2 mas ≲ RArelative ≲ 15 mas) adopting an uncertainty of 15%, ejection times including uncertainties indicated by arrows (see Table 2), SEST data (90 GHz–350 GHz) from Israel et al. (2008) and Tornikoski et al. (1996), Ceduna monitoring at 6.7 GHz, RXTE/ASM (Data taken after MJD 55 200 are affected by an instrumental decline and were therefore excluded; see, e.g., Grinberg et al. 2013) and RXTE/PCA, CGRO/BATSE and Swift/BAT data after background subtraction. The blue shaded areas highlight the time periods of substantially prolonged higher X-ray activity, defined by an X-ray flux of 3σ above the mean (indicated by orange open triangles) in the continuous monitoring light curves by RXTE/ASM, Swift/BAT, and CGRO/BATSE.
Current usage metrics show cumulative count of Article Views (full-text article views including HTML views, PDF and ePub downloads, according to the available data) and Abstracts Views on Vision4Press platform.
Data correspond to usage on the plateform after 2015. The current usage metrics is available 48-96 hours after online publication and is updated daily on week days.
Initial download of the metrics may take a while.