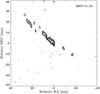
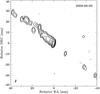
Fig. 1
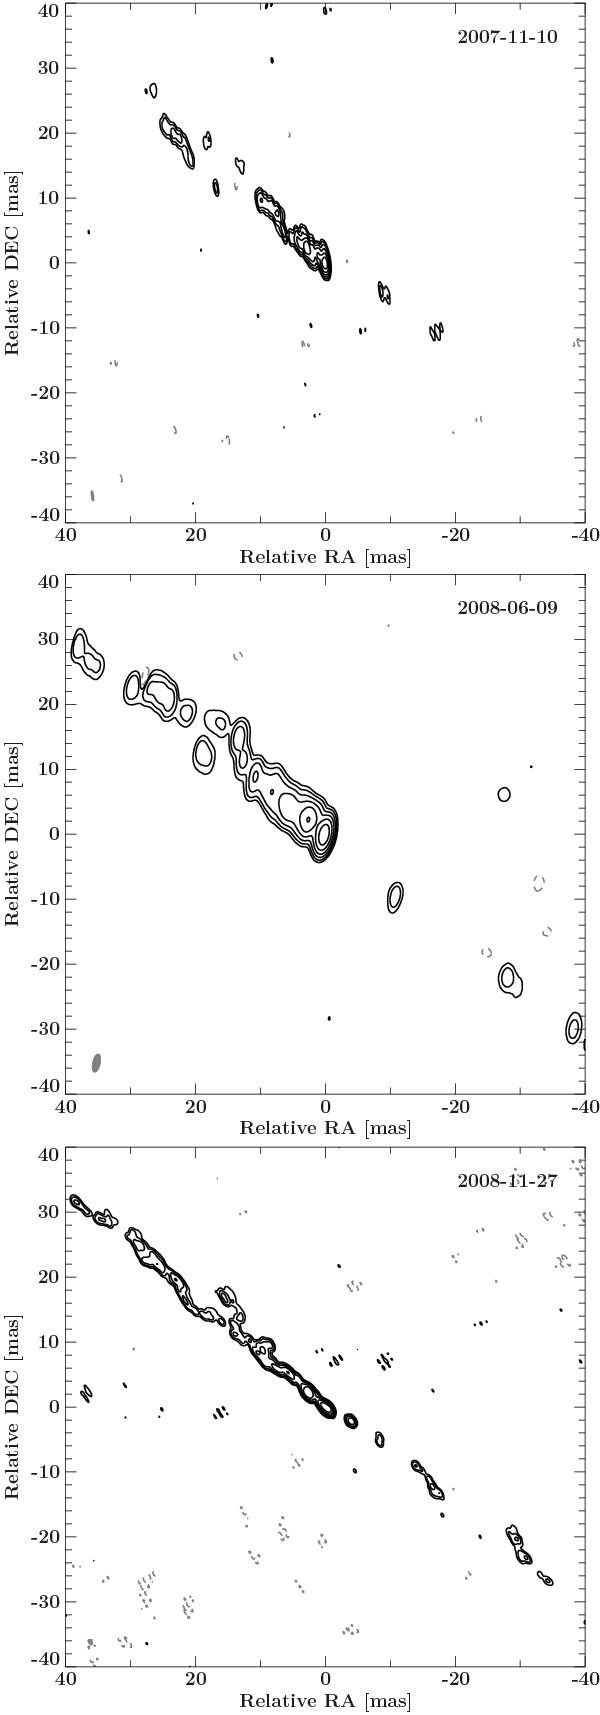
Contour images of the first three 8.4 GHz TANAMI observations with natural weighting. The black contours indicate the flux density level, scaled logarithmically and increased by a factor of 3, with the lowest level set to the 3σ-noise-level (for more details see Table 1). Negative contours are shown in gray. From top to bottom: 2007 November (Ojha et al. 2010), 2008 June, 2008 November (Paper I). The FWHM of the restoring beams for each observation is shown as a gray ellipse in the lower left corner. 1 mas in the image corresponds to 0.018 pc.
Current usage metrics show cumulative count of Article Views (full-text article views including HTML views, PDF and ePub downloads, according to the available data) and Abstracts Views on Vision4Press platform.
Data correspond to usage on the plateform after 2015. The current usage metrics is available 48-96 hours after online publication and is updated daily on week days.
Initial download of the metrics may take a while.