Free Access
Fig. 1
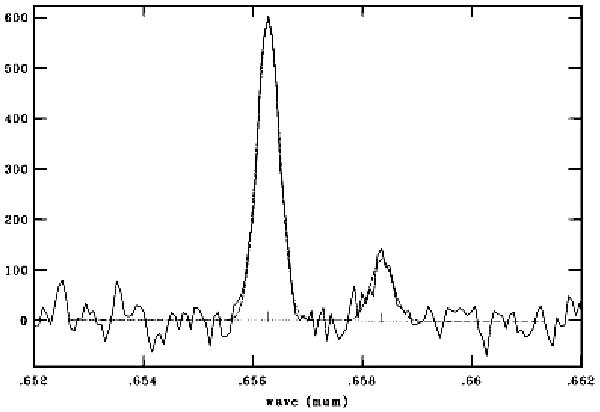
One example of the measurement of Hα and [N ii]λ6584 emission lines with splot task of IRAF. The spectrum and the fitted Gaussians are shown with solid and dotted lines respectively. Intensity units are expressed in number counts and rest-frame wavelength units in μm.
Current usage metrics show cumulative count of Article Views (full-text article views including HTML views, PDF and ePub downloads, according to the available data) and Abstracts Views on Vision4Press platform.
Data correspond to usage on the plateform after 2015. The current usage metrics is available 48-96 hours after online publication and is updated daily on week days.
Initial download of the metrics may take a while.