Free Access
Fig. 6
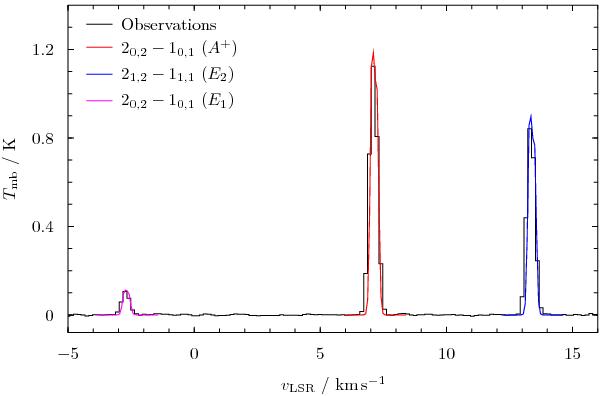
Observed vs. modelled spectrum of CH3OH in L1544. The black histogram shows the observations. Coloured lines indicate the best-fit modelled spectra. The velocity axis is centred on the 20,2 − 10,1 (A+) line at 7.2 km s-1.
Current usage metrics show cumulative count of Article Views (full-text article views including HTML views, PDF and ePub downloads, according to the available data) and Abstracts Views on Vision4Press platform.
Data correspond to usage on the plateform after 2015. The current usage metrics is available 48-96 hours after online publication and is updated daily on week days.
Initial download of the metrics may take a while.