Fig. 3
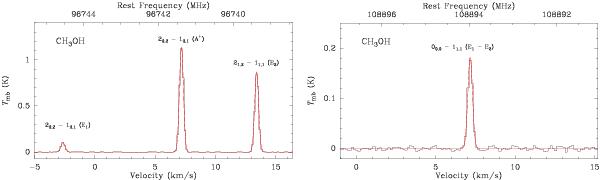
CH3OH lines observed towards the (0′′, 0′′) position of L1544. Left: group of 21,2 − 11,1 and 20,2 − 20,1 transitions. Right: 00,0 − 11,1 (E1 − E2) line. The spectral rms is ~3 mK. The red solid line plots the Gaussian fit obtained using CLASS.
Current usage metrics show cumulative count of Article Views (full-text article views including HTML views, PDF and ePub downloads, according to the available data) and Abstracts Views on Vision4Press platform.
Data correspond to usage on the plateform after 2015. The current usage metrics is available 48-96 hours after online publication and is updated daily on week days.
Initial download of the metrics may take a while.