Fig. 2
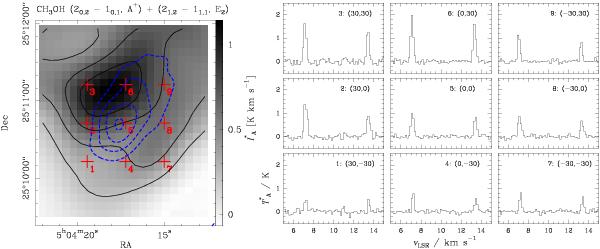
Left panel: grey-scale map of the summed integrated
intensity (units of  ) of the
20,2 −
10,1 (A+) and
21,2 −
11,1 (E2)
CH3OH lines
(30′′ angular
resolution). Five equally spaced contours from 0.23 to 1.5 K km s-1 are plotted. The blue
dashed contours plot the 1.3 mm continuum intensity map of Ward-Thompson et al. (1999) smoothed at 22′′ to improve the
signal-to-noise ratio. Contours are at 100, 140, 180, and 220 mJy flux density levels.
The red crosses represent the offset positions at which the spectra have been
extracted. Right panel: map spectra of the CH3OH transitions towards the
nine red crosses shown in the left panel. The velocity axis is
centred on the 20,2 −
10,1 (A+) line at
7.2 km s-1.
The vertical axis of each spectrum represents the
) of the
20,2 −
10,1 (A+) and
21,2 −
11,1 (E2)
CH3OH lines
(30′′ angular
resolution). Five equally spaced contours from 0.23 to 1.5 K km s-1 are plotted. The blue
dashed contours plot the 1.3 mm continuum intensity map of Ward-Thompson et al. (1999) smoothed at 22′′ to improve the
signal-to-noise ratio. Contours are at 100, 140, 180, and 220 mJy flux density levels.
The red crosses represent the offset positions at which the spectra have been
extracted. Right panel: map spectra of the CH3OH transitions towards the
nine red crosses shown in the left panel. The velocity axis is
centred on the 20,2 −
10,1 (A+) line at
7.2 km s-1.
The vertical axis of each spectrum represents the
 scale in K, as
shown in the lower leftmost panel.
scale in K, as
shown in the lower leftmost panel.
Current usage metrics show cumulative count of Article Views (full-text article views including HTML views, PDF and ePub downloads, according to the available data) and Abstracts Views on Vision4Press platform.
Data correspond to usage on the plateform after 2015. The current usage metrics is available 48-96 hours after online publication and is updated daily on week days.
Initial download of the metrics may take a while.