Fig. 1
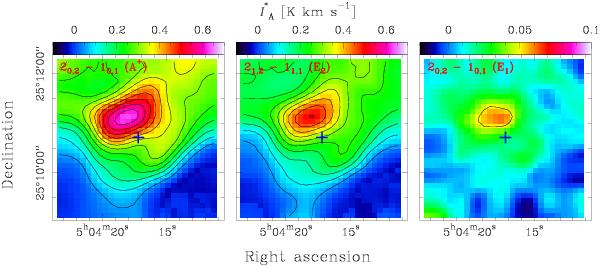
Intensity maps (units of  ) of the
20,2 −
10,1 (A+),
21,2 −
11,1 (E2), and
20,2 −
10,1 (E1)
transitions of CH3OH integrated over 0.5 km s-1 velocity interval. The
L1544 dust peak position located at α(J2000) = 05h04m17.21s, δ(J2000) =
+25°10′42.8′′ is indicated by the blue cross marker. The first
contour is at 5σ and the increment is 5σ for all three maps;
note however that the colour scale is different for the weak 20,2 −
10,1 (E1) line
(right panel). The images were smoothed to a 30′′ angular resolution to
increase the signal-to-noise ratio (1σ ≈ 10-2 K km s-1).
) of the
20,2 −
10,1 (A+),
21,2 −
11,1 (E2), and
20,2 −
10,1 (E1)
transitions of CH3OH integrated over 0.5 km s-1 velocity interval. The
L1544 dust peak position located at α(J2000) = 05h04m17.21s, δ(J2000) =
+25°10′42.8′′ is indicated by the blue cross marker. The first
contour is at 5σ and the increment is 5σ for all three maps;
note however that the colour scale is different for the weak 20,2 −
10,1 (E1) line
(right panel). The images were smoothed to a 30′′ angular resolution to
increase the signal-to-noise ratio (1σ ≈ 10-2 K km s-1).
Current usage metrics show cumulative count of Article Views (full-text article views including HTML views, PDF and ePub downloads, according to the available data) and Abstracts Views on Vision4Press platform.
Data correspond to usage on the plateform after 2015. The current usage metrics is available 48-96 hours after online publication and is updated daily on week days.
Initial download of the metrics may take a while.