Fig. 9
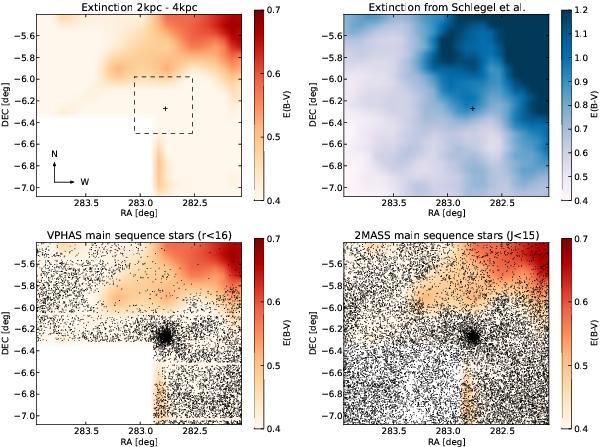
Top left: extinction map obtained from VPHAS+ photometry in the distance range 2−4 kpc. The cross indicates the centre of the cluster. The dashed line shows the footprint of our BVI photometry. Bottom left: same extinction map. The black points are cluster stars selected from the (r − i,r) VPHAS+ CMD, with r< 16. The CCD gaps are visible as horizontal lines. Top right: extinction map from Schlegel (1998) for this field. Bottom right: same as bottom left, but with 2MASS main-sequence stars (J< 15).
Current usage metrics show cumulative count of Article Views (full-text article views including HTML views, PDF and ePub downloads, according to the available data) and Abstracts Views on Vision4Press platform.
Data correspond to usage on the plateform after 2015. The current usage metrics is available 48-96 hours after online publication and is updated daily on week days.
Initial download of the metrics may take a while.