Fig. 18
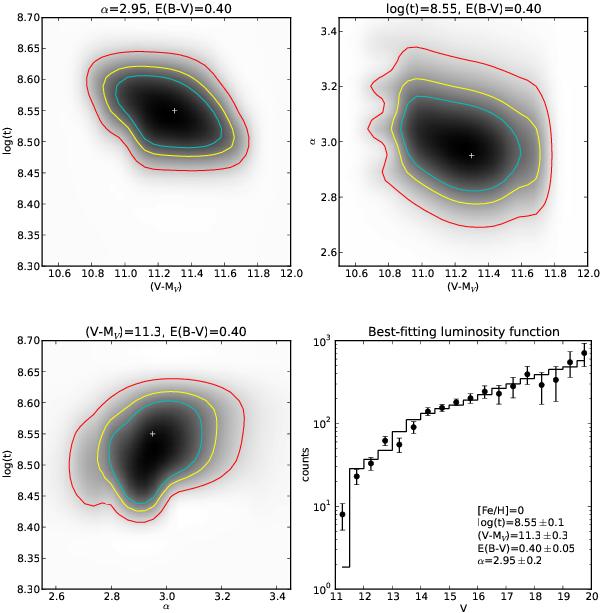
Probability contours for the fit of the luminosity function. The cyan, yellow, and red lines show the 50%, 68%, and 90% confidence regions, respectively. The white cross indicates the best-fitting solution. The bottom right panel shows the observed LF (cleaned from the background) and the best-fitting theoretical one. The bins with V> 18 are shown but were not used in the fitting procedure.
Current usage metrics show cumulative count of Article Views (full-text article views including HTML views, PDF and ePub downloads, according to the available data) and Abstracts Views on Vision4Press platform.
Data correspond to usage on the plateform after 2015. The current usage metrics is available 48-96 hours after online publication and is updated daily on week days.
Initial download of the metrics may take a while.