Fig. 9
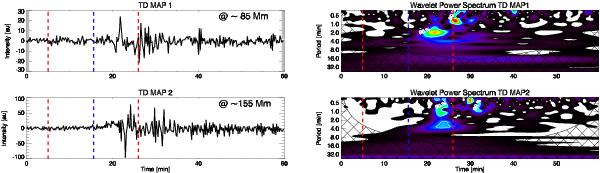
Left panels: time variation of the EUV intensity perturbations in the rapidly propagating quasi-periodic wave trains, extracted from TD MAP 1 and 2 at a position of about 85 and 155 Mm (see Fig. 8). The perturbations are shown in arbitrary units. The red vertical dashed lines mark the start and peak of the flare. The blue vertical dashed line indicates the time of the sudden increase in the soft X-ray flux. The sequence of the propagating wave train fronts is seen as the increase in the amplitude of the intensity variation. Right panels: wavelet spectra of the signals.
Current usage metrics show cumulative count of Article Views (full-text article views including HTML views, PDF and ePub downloads, according to the available data) and Abstracts Views on Vision4Press platform.
Data correspond to usage on the plateform after 2015. The current usage metrics is available 48-96 hours after online publication and is updated daily on week days.
Initial download of the metrics may take a while.