Fig. 6
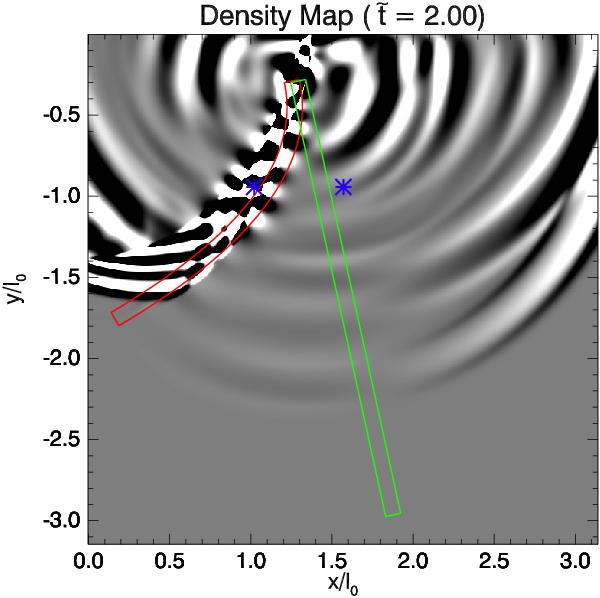
Running-difference perturbations of the plasma density in the numerical simulation at
 . The red and green lines
are the slits used to construct the time-distance maps. The asteriskes show the
spatial locations where temporal signals were measured. The FOV shown in this figure
covers the right half of the panels shown in Fig. 5. A movie of the numerical simulation is available online.
. The red and green lines
are the slits used to construct the time-distance maps. The asteriskes show the
spatial locations where temporal signals were measured. The FOV shown in this figure
covers the right half of the panels shown in Fig. 5. A movie of the numerical simulation is available online.
Current usage metrics show cumulative count of Article Views (full-text article views including HTML views, PDF and ePub downloads, according to the available data) and Abstracts Views on Vision4Press platform.
Data correspond to usage on the plateform after 2015. The current usage metrics is available 48-96 hours after online publication and is updated daily on week days.
Initial download of the metrics may take a while.