Fig. 5
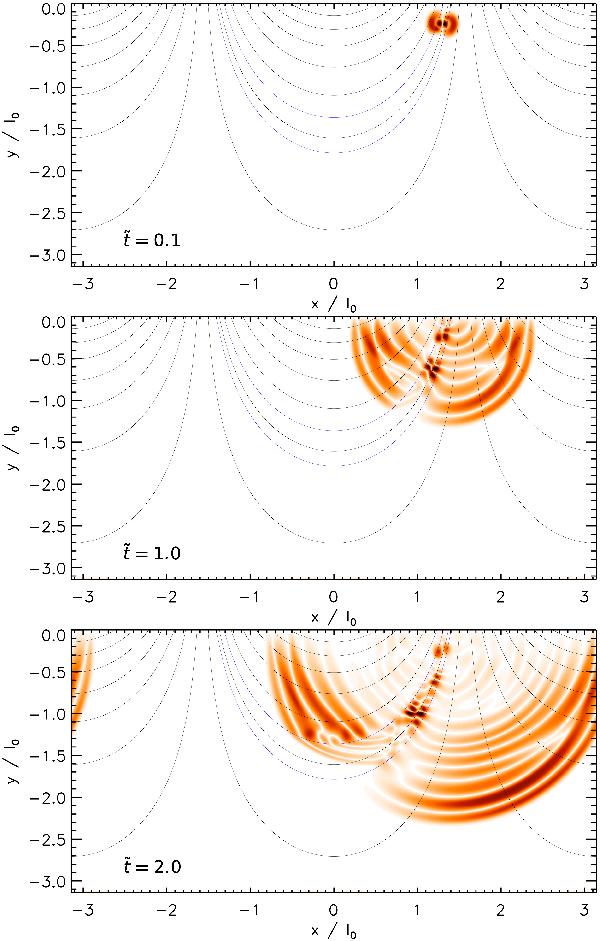
Snapshots representing the temporal evolution of the absolute value of the induced
flow velocity in the numerical simulation, at times
 , 1 and 2 (from
top to bottom). The blue lines outline the wave guiding coronal loop. Note
the rotation of the domain in comparison with the top panel in Fig. 4.
, 1 and 2 (from
top to bottom). The blue lines outline the wave guiding coronal loop. Note
the rotation of the domain in comparison with the top panel in Fig. 4.
Current usage metrics show cumulative count of Article Views (full-text article views including HTML views, PDF and ePub downloads, according to the available data) and Abstracts Views on Vision4Press platform.
Data correspond to usage on the plateform after 2015. The current usage metrics is available 48-96 hours after online publication and is updated daily on week days.
Initial download of the metrics may take a while.