Fig. 3
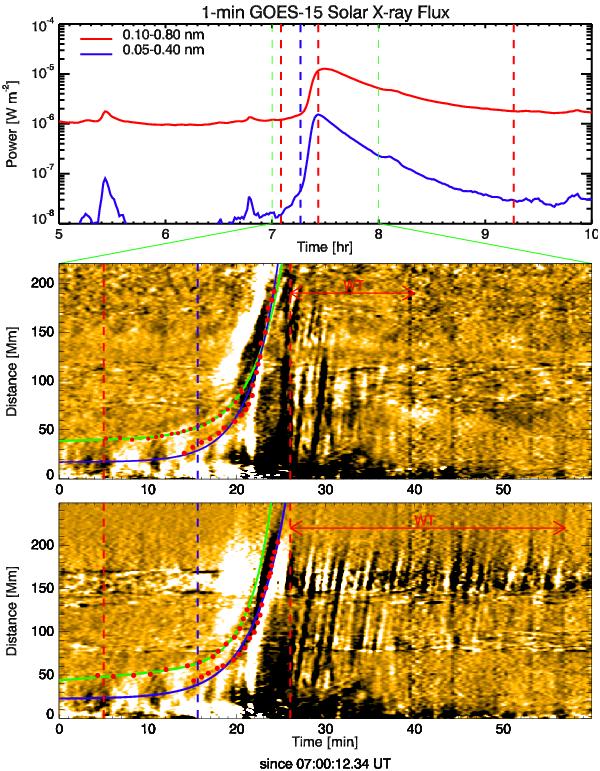
Top: temporal evolution of the soft X-ray intensity at short (red) and long (blue) wavelengths from GOES-15. The vertical green dashed lines define the time window of our observation between 07:00–08:00 UT. The vertical red dashed lines represent the start, the peak and the end of the flare activity (note the long tail after the peak), whilst the blue dashed line marks the start of the ramp in X-ray flux. Middle and bottom: TD maps from the curved and straight slits. The red dots mark the position in time of the eruption fronts (shock/CME), which are fitted by exponential curves (green and blue lines). Note the correspondence between the initial and exponential growth with the start and peak of the flare (red dashed lines). The wave train is depicted as periodic straight intensity variations (double arrow labelled “WT”).
Current usage metrics show cumulative count of Article Views (full-text article views including HTML views, PDF and ePub downloads, according to the available data) and Abstracts Views on Vision4Press platform.
Data correspond to usage on the plateform after 2015. The current usage metrics is available 48-96 hours after online publication and is updated daily on week days.
Initial download of the metrics may take a while.