Fig. 2
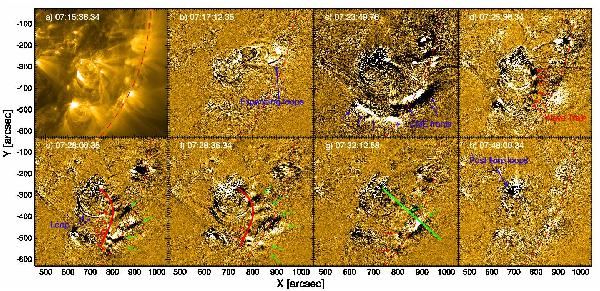
Sequence of the SDO/AIA FOV at 171 Å showing the formation of the wave train. Panel a) shows the analysed FOV in normal intensity, other panels show it in running-difference intensity at different instants of time to highlight dynamical changes. We outline with blue arrows some temporarily evolving features, such as expanding loops b), CME fronts c), oscillating loops during the flare e), post-flare loops h). The wave train fronts are visible in panels d)–g) as periodically spaced bright and dark regions. The red arrows mark the position of a narrow wave train that follows a curved path, while the green arrows mark a large extended wave train. The red and green lines in panels e)–f) and g) locate the position of slits to create time-distance maps. A movie with the temporal evolution is available online, with the left panel showing the normal-intensity images and the right one the running-difference images.
Current usage metrics show cumulative count of Article Views (full-text article views including HTML views, PDF and ePub downloads, according to the available data) and Abstracts Views on Vision4Press platform.
Data correspond to usage on the plateform after 2015. The current usage metrics is available 48-96 hours after online publication and is updated daily on week days.
Initial download of the metrics may take a while.