Fig. 3
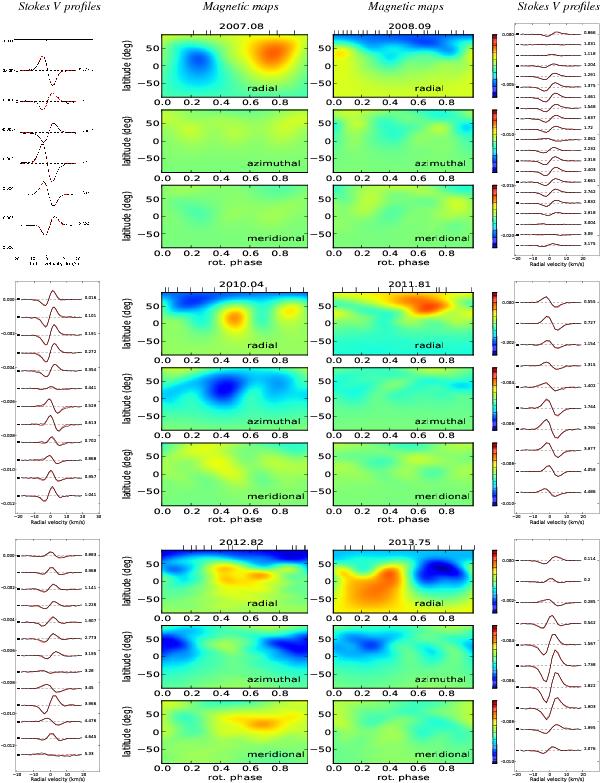
Magnetic field maps of ϵ Eridani reconstructed for 2007.08, 2008.09, 2010.04, 2011.81, 2012.82, and 2013.75, shown with the Stokes V fits to the sides. For each image the magnetic field projection is shown in terms of poloidal (upper), toroidal (middle), and meridional (lower) field components, where red indicates positive polarity and blue negative polarity. The magnetic field strength is in Gauss where for each map the scale is identical (Bmax = 45 G). The tick marks at the top of each poloidal field map indicate the observational phases used to reconstruct the large-scale magnetic field geometry. Given that the inclination of ϵ Eridani is 46°, there is no information on the magnetic field topology in the lower 1/4 of each image. The Stokes V profiles are plotted separated by a constant value for clarity.
Current usage metrics show cumulative count of Article Views (full-text article views including HTML views, PDF and ePub downloads, according to the available data) and Abstracts Views on Vision4Press platform.
Data correspond to usage on the plateform after 2015. The current usage metrics is available 48-96 hours after online publication and is updated daily on week days.
Initial download of the metrics may take a while.