Fig. 8
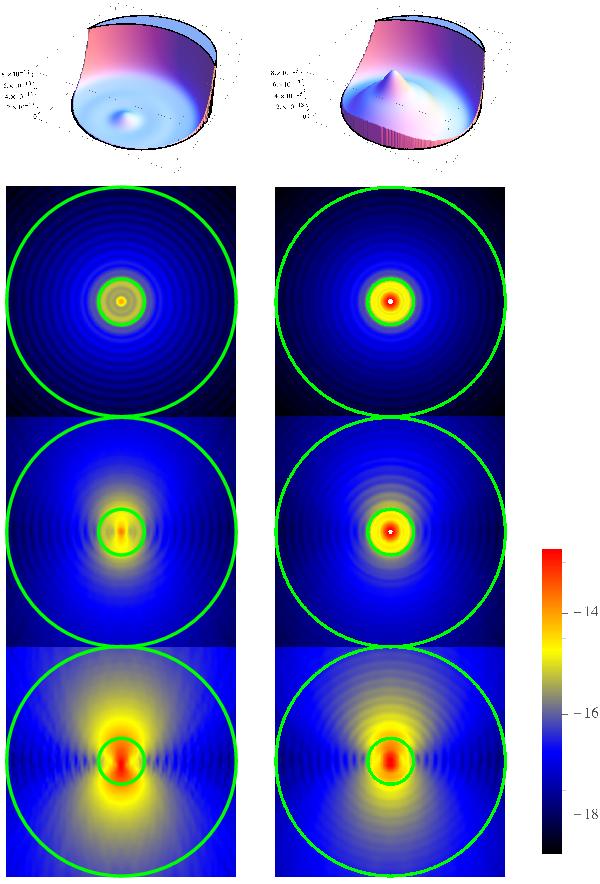
Top curves: pupil plane intensities for an offset of 1 m for λ ∈ (380, 750) nm. Density curves below represent the focal plane intensities (log scale) for telescope positions: on-axis (upper curves) and offsets of 50 cm (intermediate curves) and 1 m (lower curves). Left: aperture optimization, right: focal plane optimization.
Current usage metrics show cumulative count of Article Views (full-text article views including HTML views, PDF and ePub downloads, according to the available data) and Abstracts Views on Vision4Press platform.
Data correspond to usage on the plateform after 2015. The current usage metrics is available 48-96 hours after online publication and is updated daily on week days.
Initial download of the metrics may take a while.