Fig. 6
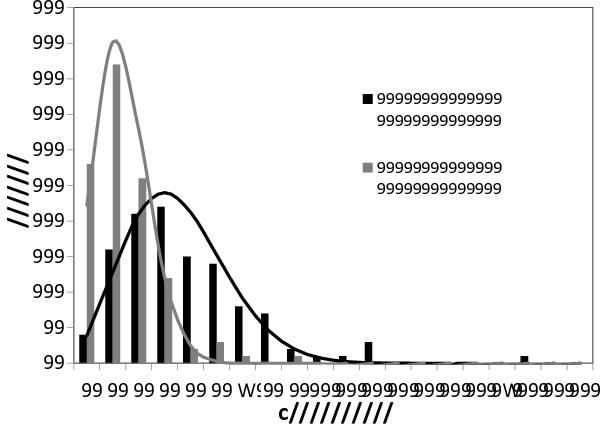
Number of objects versus rotational rate in cycles/day: two different samples are plotted. Black bars: the entire sample considering that all the light curves are single-peaked (number of objects (N) = 115). Gray bars: the entire sample considering double-period light curves. A Maxwellian fit to the entire sample assuming a single period distribution gives a mean rotational period of 5.35 h (σ = 2.813 ± 0.262, continuous black line). The Maxwellian fit of the second sample gives a mean rotational period of 10.11 h (σ = 1.488 ± 0.139, continuous gray line).
Current usage metrics show cumulative count of Article Views (full-text article views including HTML views, PDF and ePub downloads, according to the available data) and Abstracts Views on Vision4Press platform.
Data correspond to usage on the plateform after 2015. The current usage metrics is available 48-96 hours after online publication and is updated daily on week days.
Initial download of the metrics may take a while.