Fig. 9
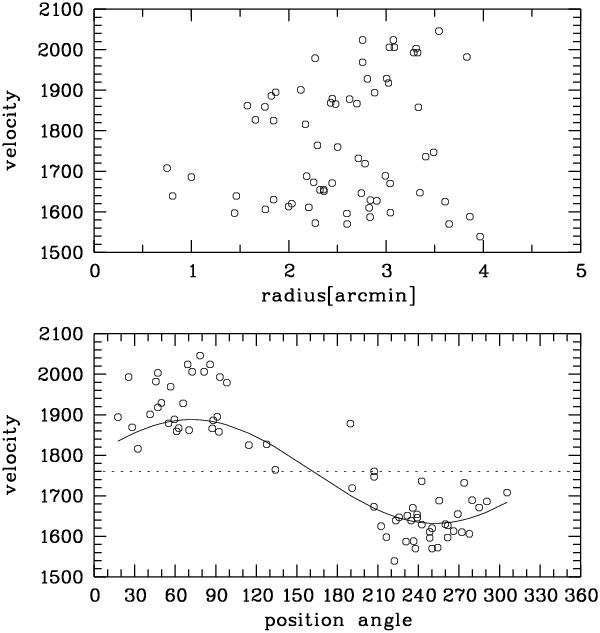
Upper panel: radial distribution of galaxy velocities. Lower panel: distribution of galaxy velocities over position angles. The displayed rotation signal (represented by a sine curve) has an amplitude of 128 km s-1, corresponding to the inner clusters, and peaks at 72°. The centre of rotation, indicated by the horizontal line, has the value 1760 km s-1.
Current usage metrics show cumulative count of Article Views (full-text article views including HTML views, PDF and ePub downloads, according to the available data) and Abstracts Views on Vision4Press platform.
Data correspond to usage on the plateform after 2015. The current usage metrics is available 48-96 hours after online publication and is updated daily on week days.
Initial download of the metrics may take a while.