Fig. 5
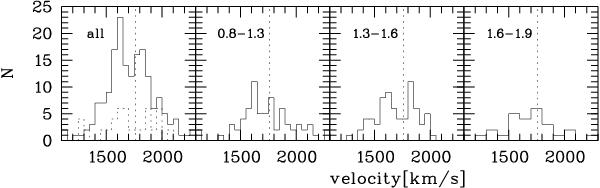
Radial velocity histograms for different colour intervals, corresponding to different cluster populations (see text). Typical uncertainties are of the of order 50–80 km s-1 (compare Fig. 2). The vertical dotted line indicates the systemic velocity. The dotted histogram in the left panel is the velocity histogram of Goudfrooij et al. (2001b), where the two velocity peaks already are discernable. We interpret the peak at 1800 km s-1 as the expected peak at the systemic velocity. The peak at 1600 km s-1 is caused by a dominance of clusters with this velocity in the western part of NGC 1316.
Current usage metrics show cumulative count of Article Views (full-text article views including HTML views, PDF and ePub downloads, according to the available data) and Abstracts Views on Vision4Press platform.
Data correspond to usage on the plateform after 2015. The current usage metrics is available 48-96 hours after online publication and is updated daily on week days.
Initial download of the metrics may take a while.