Fig. 4
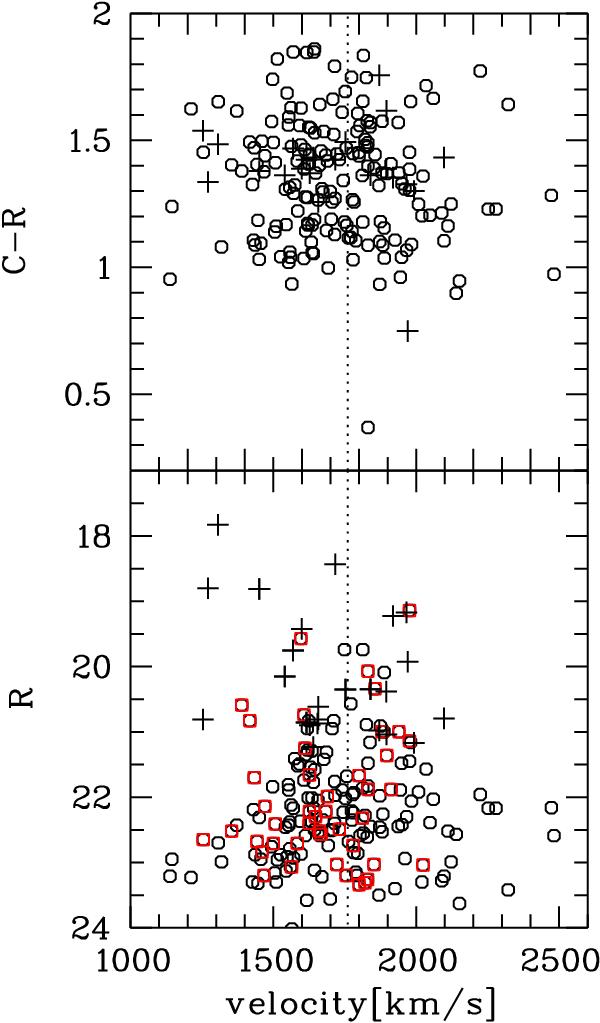
Upper panel: velocities versus colour. Open circles denote the present GC sample, crosses the objects of Goudfrooij et al. (2001b). In both panels, the systemic velocity is marked by the dotted vertical line. The bimodal colour distribution is clearly visible. We note that the objects belonging to the peak at C − R = 1.4 avoid velocities higher than the systemic velocity. Lower panel: velocities versus R-magnitude. The brightest clusters do not show a kinematic affinity to the bulge population. We also note also the increasing velocity dispersion for clusters fainter than R = 21.5.
Current usage metrics show cumulative count of Article Views (full-text article views including HTML views, PDF and ePub downloads, according to the available data) and Abstracts Views on Vision4Press platform.
Data correspond to usage on the plateform after 2015. The current usage metrics is available 48-96 hours after online publication and is updated daily on week days.
Initial download of the metrics may take a while.