Fig. 13
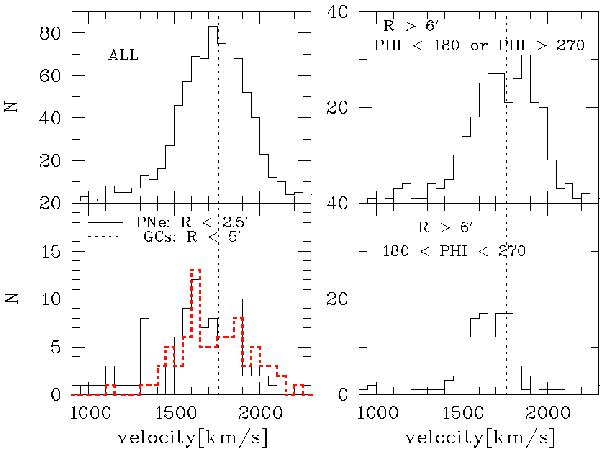
For comparison with the GCs, some PNe samples are shown. Upper-left panel: entire sample for comparison. Lower-left panel: inner PNe (solid line). We note the striking similarity with the globular clusters (dashed red line). Upper-right panel: outer PNe covering a position angle interval of 270° with the exception of the south-western quadrant. Here the velocity distribution is symmetric with respect to the systemic velocity. This histogram is meant as a supplement to the lower-right panel. Lower-right panel: the south-western quadrant. As in the case of globular clusters (Fig. 5), the velocity distribution is shifted towards lower velocities. The peak at 1600 km s-1 is not as pronounced as in the case of globular clusters.
Current usage metrics show cumulative count of Article Views (full-text article views including HTML views, PDF and ePub downloads, according to the available data) and Abstracts Views on Vision4Press platform.
Data correspond to usage on the plateform after 2015. The current usage metrics is available 48-96 hours after online publication and is updated daily on week days.
Initial download of the metrics may take a while.