Fig. 8
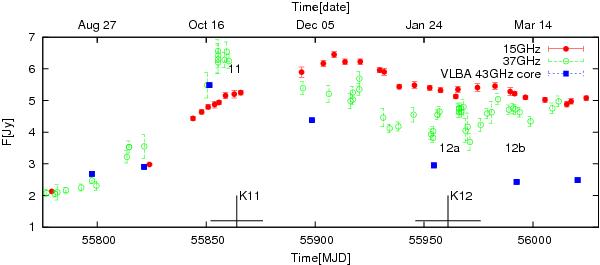
15 GHz, 37 GHz and 43 GHz VLBA core long-term light curves from MJD 55 750 (2011 July 8) to MJD 56 030 (2012 April 13). The flux of the VLBA core at 43 GHz traces the shape of the 37 GHz light curve, indicating that the major part of the total flux originates in there. Moreover, the new components found at 43 GHz are coincident with flux increase in the 37 GHz band. The symbols at the bottom of the plot show the zero separation epochs with the error bars of the components K11 and K12 from the 43 GHz VLBA core (see text).
Current usage metrics show cumulative count of Article Views (full-text article views including HTML views, PDF and ePub downloads, according to the available data) and Abstracts Views on Vision4Press platform.
Data correspond to usage on the plateform after 2015. The current usage metrics is available 48-96 hours after online publication and is updated daily on week days.
Initial download of the metrics may take a while.