Fig. 6
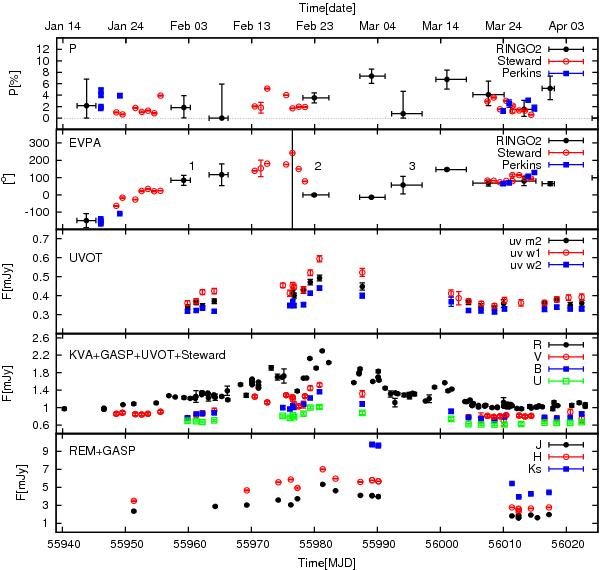
Light curves of PKS 1510−089 in the UV, optical and near IR bands. The optical polarisation degree and angle are also shown in the two top panels. The next panels show UV (Swift-UVOT, middle), optical (KVA/GASP/UVOT, second from bottom) and near IR (REM and GASP, bottom) light curves of the source. The numbers in the second from the top panel refers to the rotations of the EVPA discussed in the text. Vertical line indicates the time when the PA changes by ~90° between the highlighted point and the previous point (see text). The fluxes are given in mJy and are not corrected for Galactic absorption.
Current usage metrics show cumulative count of Article Views (full-text article views including HTML views, PDF and ePub downloads, according to the available data) and Abstracts Views on Vision4Press platform.
Data correspond to usage on the plateform after 2015. The current usage metrics is available 48-96 hours after online publication and is updated daily on week days.
Initial download of the metrics may take a while.