Fig. 4
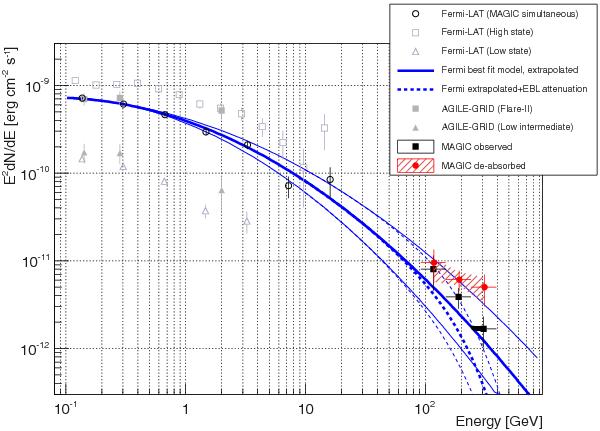
γ-ray SED constructed from AGILE, Fermi-LAT and MAGIC data. The AGILE-GRID data (grey filled squares) correspond to the data of Flare-II (from MJD 55 977.5 to 55 991.5). The Fermi-LAT spectrum (black open circles) combines all events of time intervals coincident with the MAGIC observation window (MJD 55 976 to 55 991 and from 56 001 to 56 020) with the blue lines showing the log parabola fit to the data and its statistical uncertainty (the thinner lines). The fit and the errors of the Fermi-LAT spectra have been extrapolated to MAGIC energy range. The dashed blue lines show the extrapolation with the EBL absorption effects included. The MAGIC data points are shown with black filled squares (observed) and red filled circles (de-absorbed). The corresponding shaded region indicates the statistical uncertainty of the spectral fitting (same as in the Fig. 2). The grey data shows, for the comparison, the low-intermediate state spectrum of the source as measured by AGILE-GRID (triangles) and Fermi-LAT (open triangles) and high-state SED as measured by Fermi-LAT (open squares).
Current usage metrics show cumulative count of Article Views (full-text article views including HTML views, PDF and ePub downloads, according to the available data) and Abstracts Views on Vision4Press platform.
Data correspond to usage on the plateform after 2015. The current usage metrics is available 48-96 hours after online publication and is updated daily on week days.
Initial download of the metrics may take a while.