Fig. 15
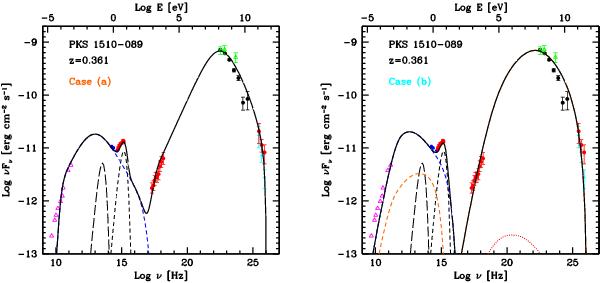
SED of PKS 1510−089 in 2012 February–April as observed by F-GAMMA and Metsähovi (magenta triangles), GASP-WEBT (blue filled circles), Swift-UVOT and XRT (red filled circles), Fermi-LAT (black filled circles), AGILE-GRID (Flare-II, green triangles) and MAGIC (cyan, observed; red, EBL corrected). Left: the solid black curve shows the overall emission modelled, where the low energy bump is dominated by the synchrotron emission (blue dashed line) and the high energy bump is dominated by the external Compton mechanism, using the infrared torus (long dashed line) photons as seed photons (case a). The short dashed line is the thermal component from the accretion disc. Right: the black curve shows the model assuming that the emission region is located at the radio core (case b). The orange dashed line shows the additional external photon field representing the slow sheath of the jet. The red dotted line indicates the synchrotron self Compton emission from this region.
Current usage metrics show cumulative count of Article Views (full-text article views including HTML views, PDF and ePub downloads, according to the available data) and Abstracts Views on Vision4Press platform.
Data correspond to usage on the plateform after 2015. The current usage metrics is available 48-96 hours after online publication and is updated daily on week days.
Initial download of the metrics may take a while.