Fig. 11
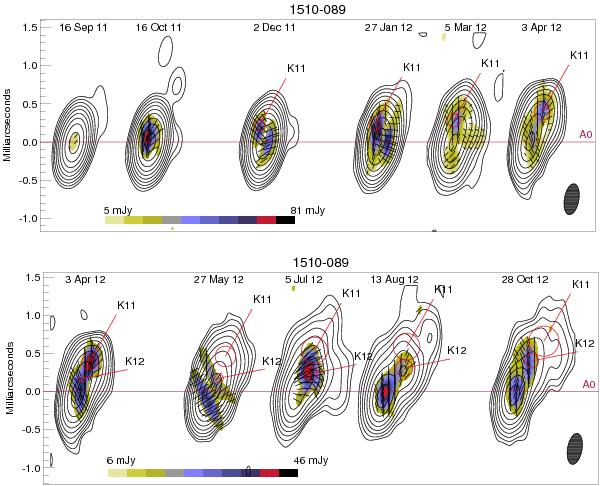
43 GHz total (contours) and polarised (colour scale) intensity images of PKS
1510−089 from 2011 September to 2012 April (top) and 2012 April to
October (bottom) with Speak = 2.58 Jy/beam,
 mJy/beam, and a Gaussian restoring
beam = 0.14 × 0.39
mas2 at PA
= − 10° (in the right
bottom corner); contours represent 0.25, 0.5,...,64, 90% of the peak intensity; line
segments within the colour scale show direction of linear polarisation; solid lines
indicate position of components across the epoch, the core A0, knot K11, and knot
K12.
mJy/beam, and a Gaussian restoring
beam = 0.14 × 0.39
mas2 at PA
= − 10° (in the right
bottom corner); contours represent 0.25, 0.5,...,64, 90% of the peak intensity; line
segments within the colour scale show direction of linear polarisation; solid lines
indicate position of components across the epoch, the core A0, knot K11, and knot
K12.
Current usage metrics show cumulative count of Article Views (full-text article views including HTML views, PDF and ePub downloads, according to the available data) and Abstracts Views on Vision4Press platform.
Data correspond to usage on the plateform after 2015. The current usage metrics is available 48-96 hours after online publication and is updated daily on week days.
Initial download of the metrics may take a while.