Fig. 10
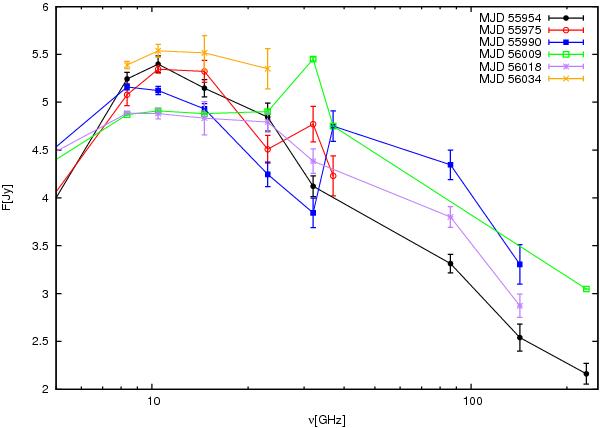
Evolution of the radio spectra over the campaign period from 2012 January 28 to April 17 (MJD 55 954, 55 975, 55 990, 56 009, 56 018 and 56 034). The first radio outburst (11 in Fig. 8) dominates the spectra in the first epoch, while in the second epoch new outburst (12a in Fig. 8) is apparent in the high frequencies. In the third epoch (12b) becomes visible in the highest frequencies with the peak moving to lower energies in the fourth and fifth epochs.
Current usage metrics show cumulative count of Article Views (full-text article views including HTML views, PDF and ePub downloads, according to the available data) and Abstracts Views on Vision4Press platform.
Data correspond to usage on the plateform after 2015. The current usage metrics is available 48-96 hours after online publication and is updated daily on week days.
Initial download of the metrics may take a while.