Fig. 7
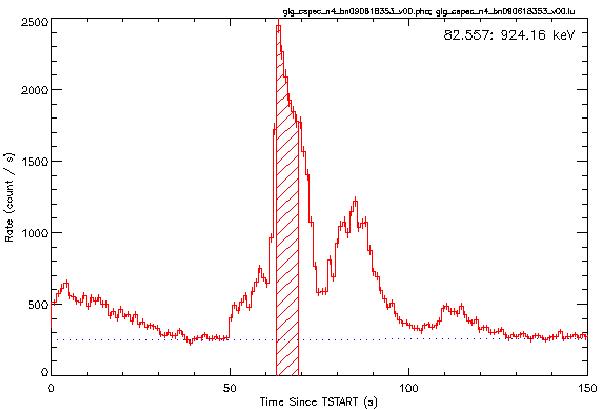
Light curve of Episode 2 in GRB 090618, ranging from 50 to 150 s. The dashed region represents the portion which would have triggered the Swift-BAT if this GRB had been at the redshift z = 8.2. The observed duration of that interval is approximately Δt ≃ 6 s. The results obtained in Fig. 6, when scaled to z = 0.54, provide ΔT ≃ 3 s.
Current usage metrics show cumulative count of Article Views (full-text article views including HTML views, PDF and ePub downloads, according to the available data) and Abstracts Views on Vision4Press platform.
Data correspond to usage on the plateform after 2015. The current usage metrics is available 48-96 hours after online publication and is updated daily on week days.
Initial download of the metrics may take a while.