Fig. A.6
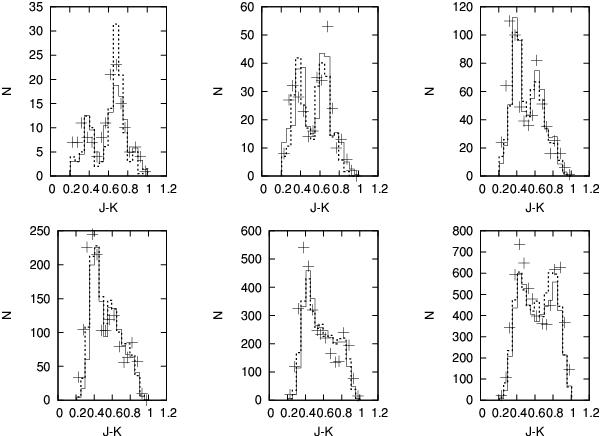
Comparison of the best-fit thick-disc model with star counts from 2MASS data in the field at longitude 110°, latitude −31°. Each panel represents a different magnitude range, from 9 to 14 in Kfrom top left to bottom right. Data are plotted as plus signs, the model of the thick disc with single-formation episode as solid lines, the model with two formation episodes as dotted lines.
Current usage metrics show cumulative count of Article Views (full-text article views including HTML views, PDF and ePub downloads, according to the available data) and Abstracts Views on Vision4Press platform.
Data correspond to usage on the plateform after 2015. The current usage metrics is available 48-96 hours after online publication and is updated daily on week days.
Initial download of the metrics may take a while.