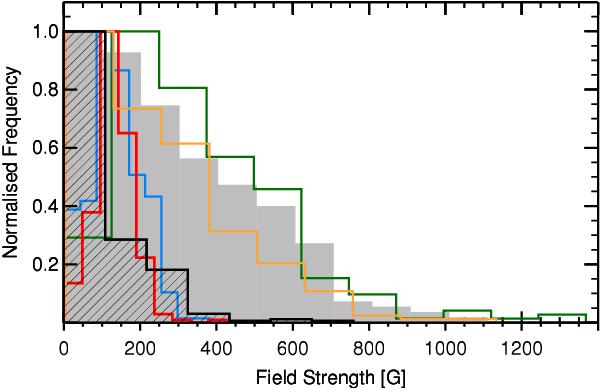
Fig. 9

Distributions of the field strength Bi deduced in the same MBPs as in Fig. 7. The (black) hashed histogram shows the distribution of B obtained from the SPINOR inversion code with pre-determined inclination angles (γp) from measurements at two heights (see main text). Other histograms illustrate the distributions of the field strength of the same magnetic features computed by inverting differently treated data and using different inversion codes (see main text) without imposing γ. The colours refer to the same inversions as in Fig. 7.
Current usage metrics show cumulative count of Article Views (full-text article views including HTML views, PDF and ePub downloads, according to the available data) and Abstracts Views on Vision4Press platform.
Data correspond to usage on the plateform after 2015. The current usage metrics is available 48-96 hours after online publication and is updated daily on week days.
Initial download of the metrics may take a while.


