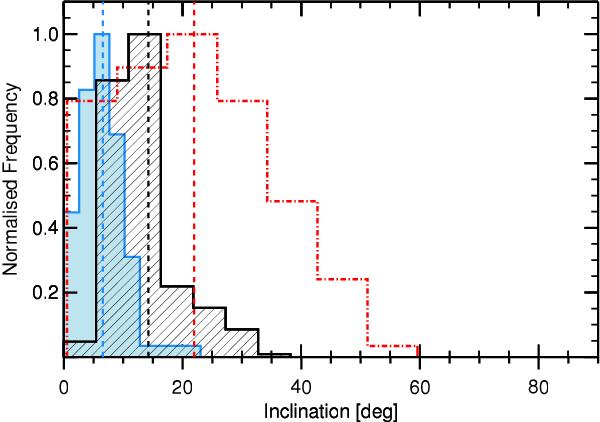
Fig. 8

Distributions of inclination of MBPs obtained from the proposed geometric method, γp (see main text). The (black) hashed, (blue) shaded and (red; dot-dashed) outlined histograms represent the distributions of γp obtained from combinations of two atmospheric layers of the IMaX/continuum-IMaX/line-core, the IMaX/continuum-SuFI/Ca ii H, and the IMaX Stokes V images made in the inner and outer flanks of the line, respectively. All histograms are normalised to their maximum values. The vertical dashed lines indicate mean values of the histograms.
Current usage metrics show cumulative count of Article Views (full-text article views including HTML views, PDF and ePub downloads, according to the available data) and Abstracts Views on Vision4Press platform.
Data correspond to usage on the plateform after 2015. The current usage metrics is available 48-96 hours after online publication and is updated daily on week days.
Initial download of the metrics may take a while.


