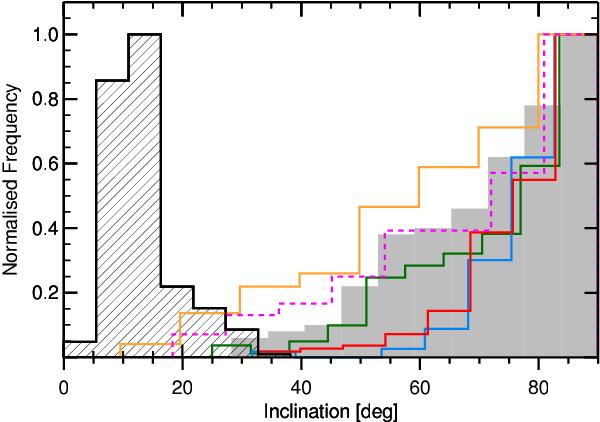
Fig. 7

Distributions of inclination relative to the line of sight of MBPs. Inclinations, γp, obtained by comparing locations of MBPs in two layers (from the IMaX/continuum-IMaX/line-core combination; see main text) are represented by the (black) hashed histogram. Distributions of magnetic inclination angles, γi, of the same magnetic features computed by inverting Stokes data (see main text) are found on the right-hand side of the plot. The different histograms result from inversions employing different codes and applying them to data treated in different ways (see main text for details). All histograms are normalised to their maximum values.
Current usage metrics show cumulative count of Article Views (full-text article views including HTML views, PDF and ePub downloads, according to the available data) and Abstracts Views on Vision4Press platform.
Data correspond to usage on the plateform after 2015. The current usage metrics is available 48-96 hours after online publication and is updated daily on week days.
Initial download of the metrics may take a while.


